





Making San Antonio


Learn About City Development
In 2010, San Antonio was listed as the most economically segregated city in the country, according to the Residential Income Segregation Index. Later, in 2019, the U.S. Census Bureau’s American Community Survey 1-year Estimate data reported that among the 25 most populous U.S. metropolitan cities, San Antonio’s metropolitan area ranked highest for poverty.
In a city where around 350,000 people live below the poverty line, while whole ZIP codes have six-digit median incomes, the question is: How did this extreme economic division come to be?

Dive deeper into the history of San Antonio and consider how it impacts your life and neighborhood today.
Historical Timeline
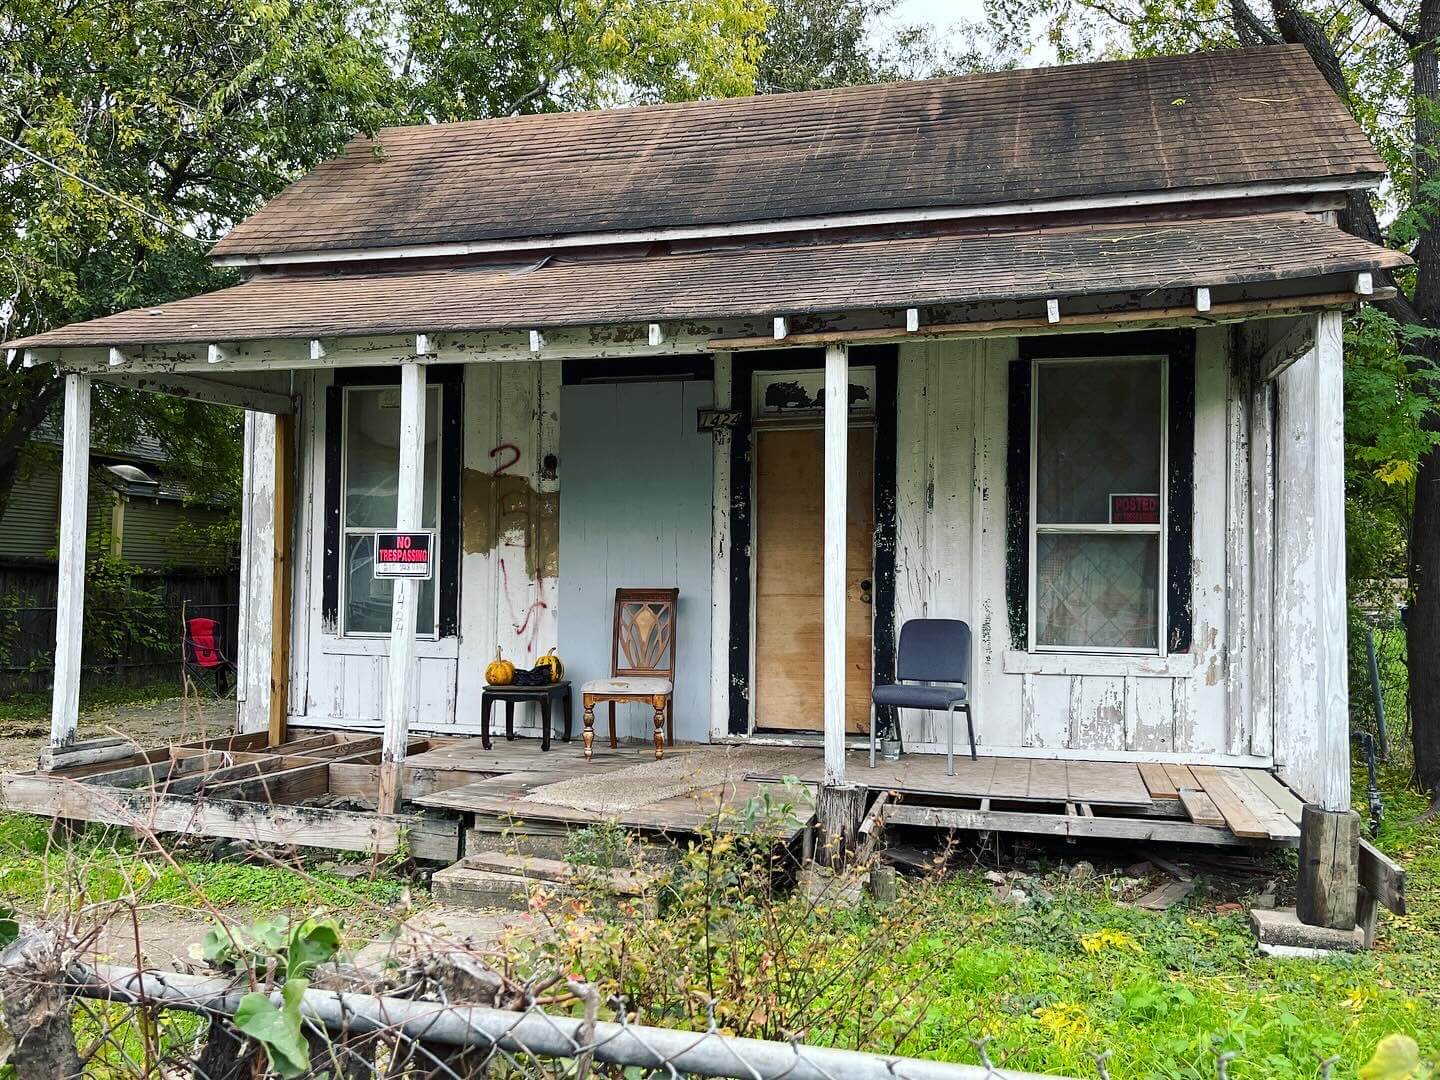
The causes of economic divisions across San Antonio’s neighborhoods can be traced all the way back to the city’s development in the late 19th century. Over time, economic disparities cemented themselves into certain neighborhoods that were originally made available for predominantly Black and Hispanic families because of racist systems such as deed restrictions and redlining. Today, we can still see the impact that decades of housing discrimination left on countless San Antonians.
Then and Now
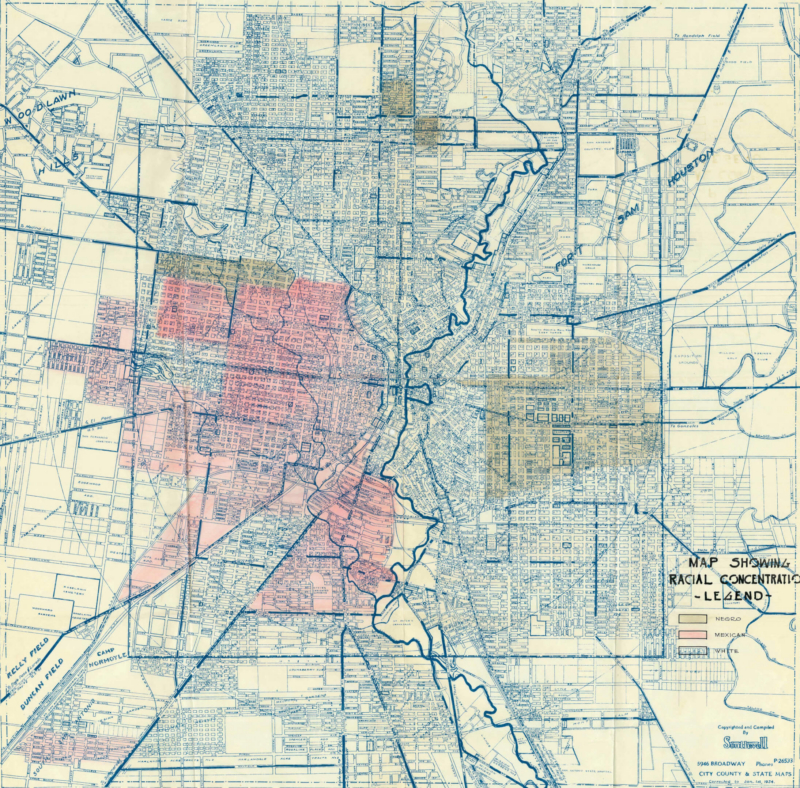
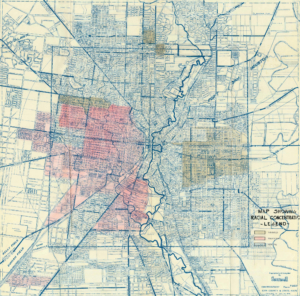
This 1935 “residential security map” was created by the Home Owners’ Loan Corporation to indicate levels of security for real estate investment in San Antonio neighborhoods. Color codes were split into 4 grades: “Type A” indicated newly developed, homogeneously white areas that were considered the best locations for mortgage lending; “Type B,” also white, neighborhoods were marked as “still desirable;” “Type C” and “Type D” neighborhoods were labeled as “definitely declining” and “hazardous” for lending, respectively, due to their non-white presence or threat of a non-white presence. Today, this practice is known as redlining.
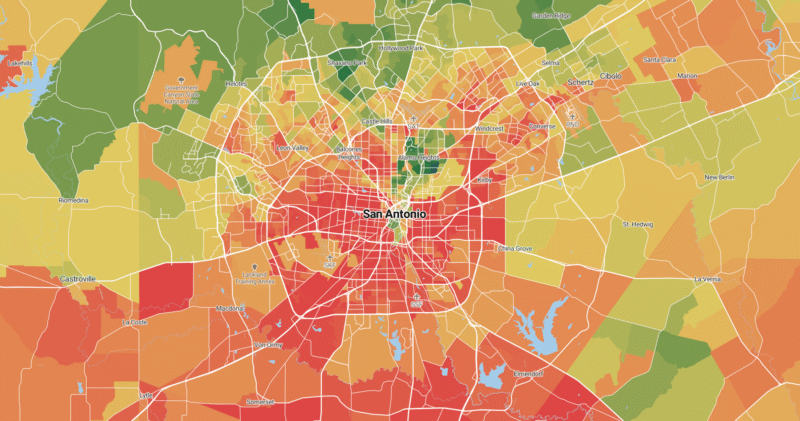
This map shows where residents in the San Antonio metro area and surrounding areas believe are the “best” places to live today. These are the “best” neighborhoods as judged by the market: the places people most want to live.
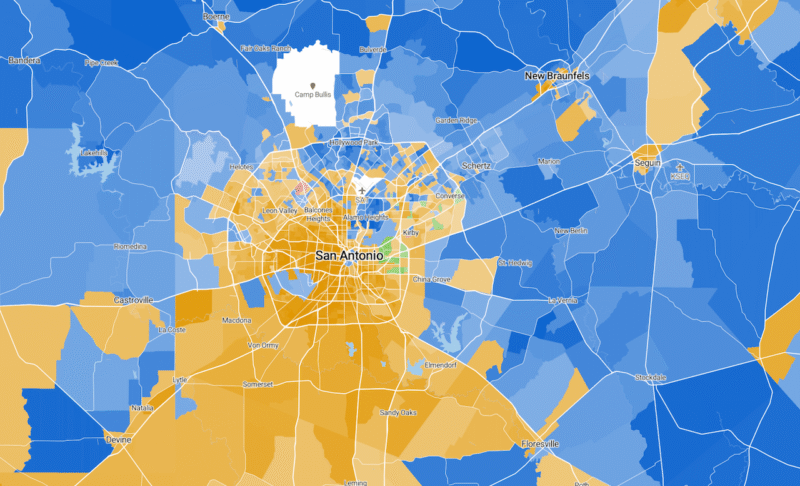
This map shows the majority race by area in the San Antonio metro area today, as self-identified on the US census.
In San Antonio, the zip code you grew up in has a direct correlation with household income, education, life expectancy, and more. The neighborhood desirability and majority race maps of today showcase the rippling effects of historically racist systems like redlining—with majority Hispanic and Black neighborhoods in the Eastside and Westside of our city and parts of the Southside experiencing systemic roadblocks.
learn More about These Issues
check out the following articles and reports:
- San Antonio Housing Choice Voucher Program, commonly known as the “Section 8” program, as explained by the San Antonio Housing Authority
- In the fight for housing justice in San Antonio, protecting renters is key by Kevin LeMelle and David Wheaton at the San Antonio Report, May 21, 2022
- ‘Tentacles’ of redlining continue to grip upward mobility in San Antonio by Madayn Mendoza at the San Antonio Express News, April 1, 2022
- Historic Roots of Modern Residential Segregation in a Southwestern Metropolis: San Antonio, Texas in 1910 and 2010 by Rebecca J. Walter, Nathan Foote, Hilton A. Cordoba, and Corey Sparks at Urban Science, June 2017
- The Status of Poverty in San Antonio, a brief report developed by the City of San Antonio’s Human Services Department and Metropolitan Health District in 2019
- The Rise of Residential Segregation by Income by Richard Fry and Paul Taylor for the Pew Research Center in 2012
- Household Income in the San Antonio Area, Texas, visualizations of data from the U. S. Census Bureau by James Diebel, Jacob Norda, and Orna Kretchmer at the Statistical Atlas
- The Highest and Lowest Income Areas in San Antonio, Texas, an interactive map from BestNeighborhood.org
Find this topic interesting? Share it with neighbors.
Knowing your neighbor starts with conversation. A Shared Table is a facilitated conversation that invites people to explore a topic affecting San Antonio by listening to the stories and perspectives of their neighbors with different lived experiences.